October 4th, 2026
“How do art historical questions and evidence intersect with geographic concepts and digital mapping methods?”1
This question opens Paul Jaskot and Anne Knowles’s article about their work mapping and spatially visualizing concentration camps during the Holocaust. Over the course of the article, the authors give us a look into how their own research evolved over time largely due to the challenges and new perspectives furthered by working with GIS mapping technology.
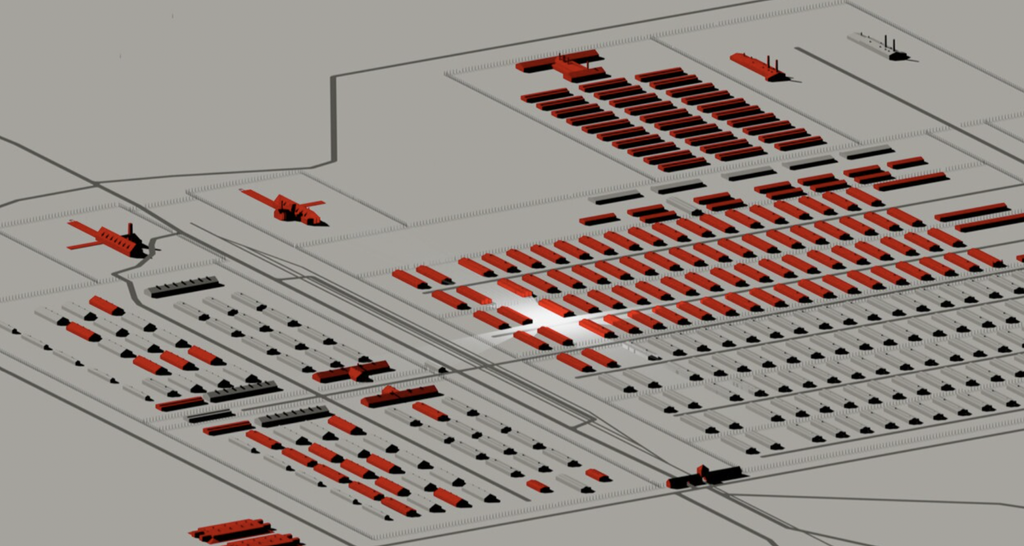
The project itself was a collaboration between art historians, historians, and GIS specialists to use GIS to visualize the development of the SS camp system over time. The first hurdle was the quality of information available—a running theme in digital art history. Though the Nazi Party kept detailed documentation, this cannot always translate into the specific coordinates or specific dates necessary for GIS systems. Translation becomes an issue here, especially in historical contexts as filled with trauma and violence as the Holocaust. Data will never be able to convey the emotional weight of these specific times and places, which is something the research team considered when they were making their model of how the Auschwitz camp expanded and evolved over time. Nonetheless, the process of visualizing the camp’s changes brought to the fore new and important research questions for the scholars.
To answer Jaskot and Knowles’ opening question, art history certainly intersects with geographic concepts and mapping—art history is, after all, still one approach to writing history, a field to which, geography, and the changing of space over time hold clear weight. Maps could allow us to visualize evolving political geographies (like national borders) and the development of different art movements, the building of monuments, etc.
Though there are so many obvious use-cases for mapping as applied to art history, the field itself lacks training in creating maps and often lacks the motivation for using them. For better or for worse, it’s a convention of the field that we begin our study with the art object, and it is this quality which makes art historians averse to viewing a map as a main source of inquiry. Particularly for contemporary art historians, merely mapping the location or structure of the works we study wouldn’t always yield interesting results. Exhibitions tend to be centered around big population centers or universities, which would not always generate an interesting map.
I myself ran into issues when trying to apply mapping to my own art historical research. Contemporary art is often well-suited to digital projects, with many artists using digital tools in their own work, and I really enjoyed making a small archive of surveillance art in collection builder last week (see here). However, when it came to mapping, I struggled to think of a map that would be useful for my research purposes. If I were to map the physical locations of the installations I study it would look like a huge cluster in New York City, a smaller cluster in LA, and some scatters throughout the rest of the country: affirming what we know about the major art centers in America. I considered creating a map which focused more on surveillance specifically, thinking of the pre-existing Flock camera maps (see here), but quickly thought that I don’t have the technical capabilities to do so.
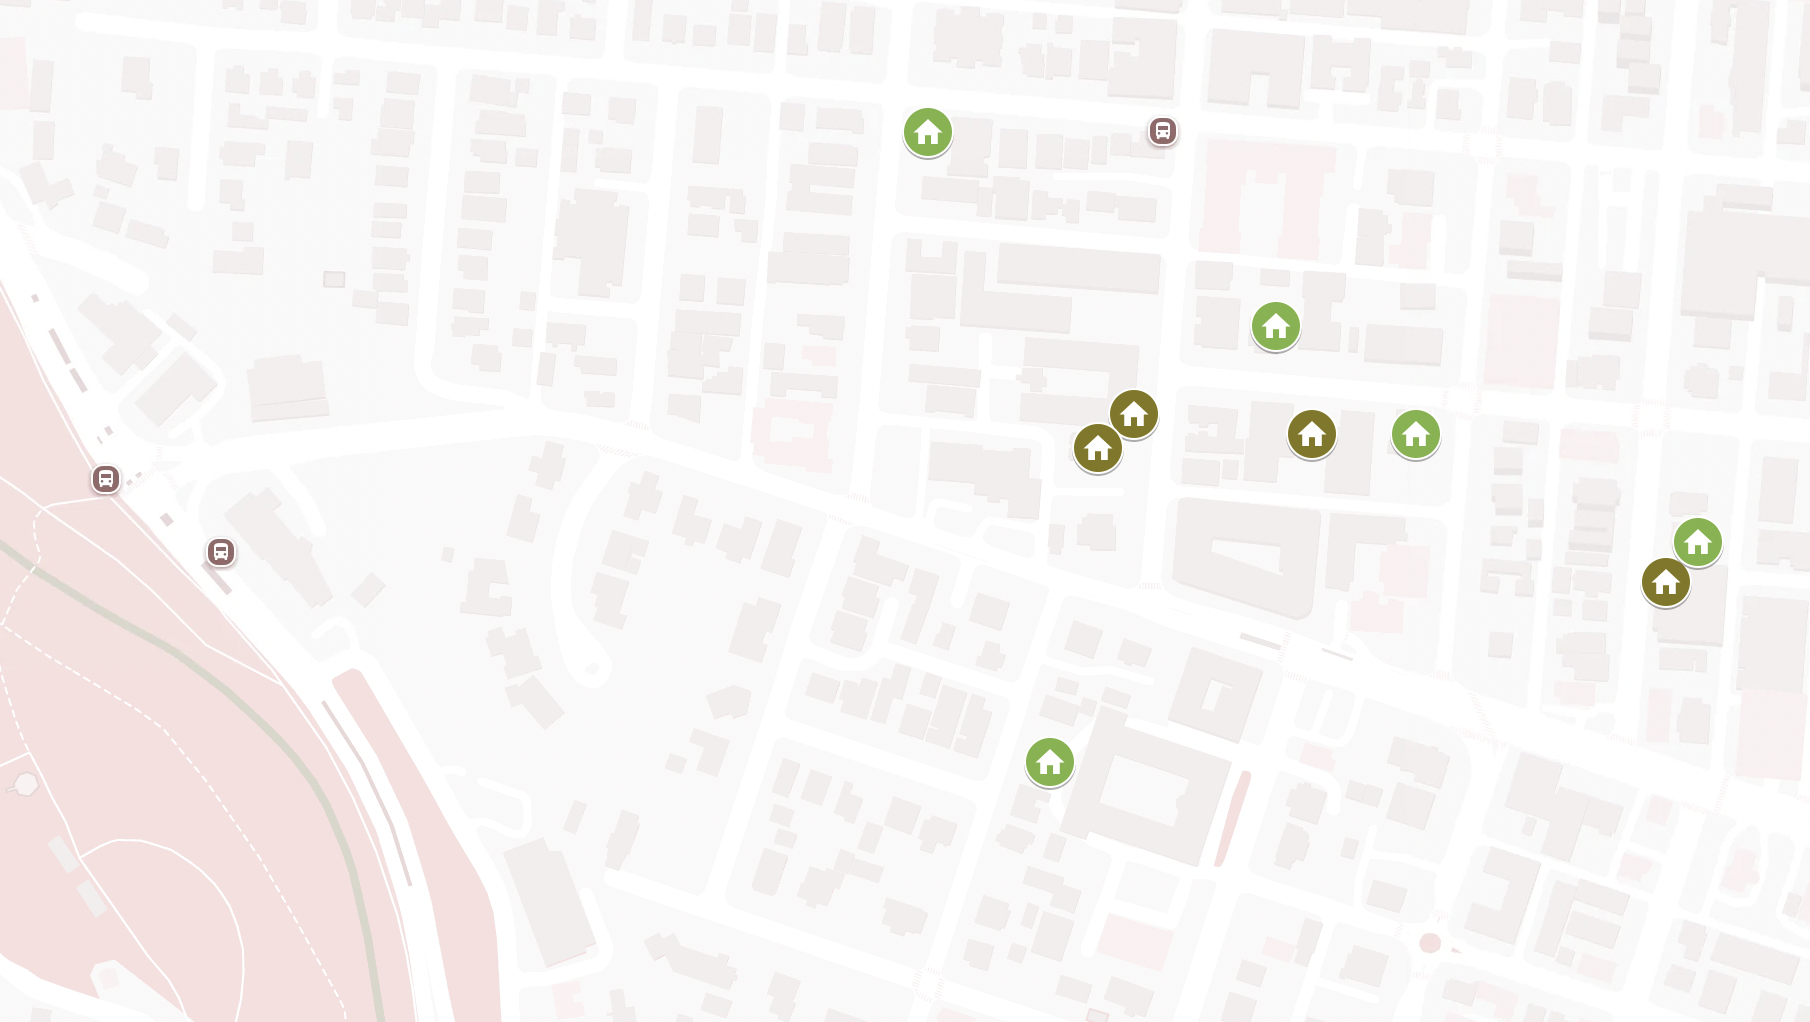
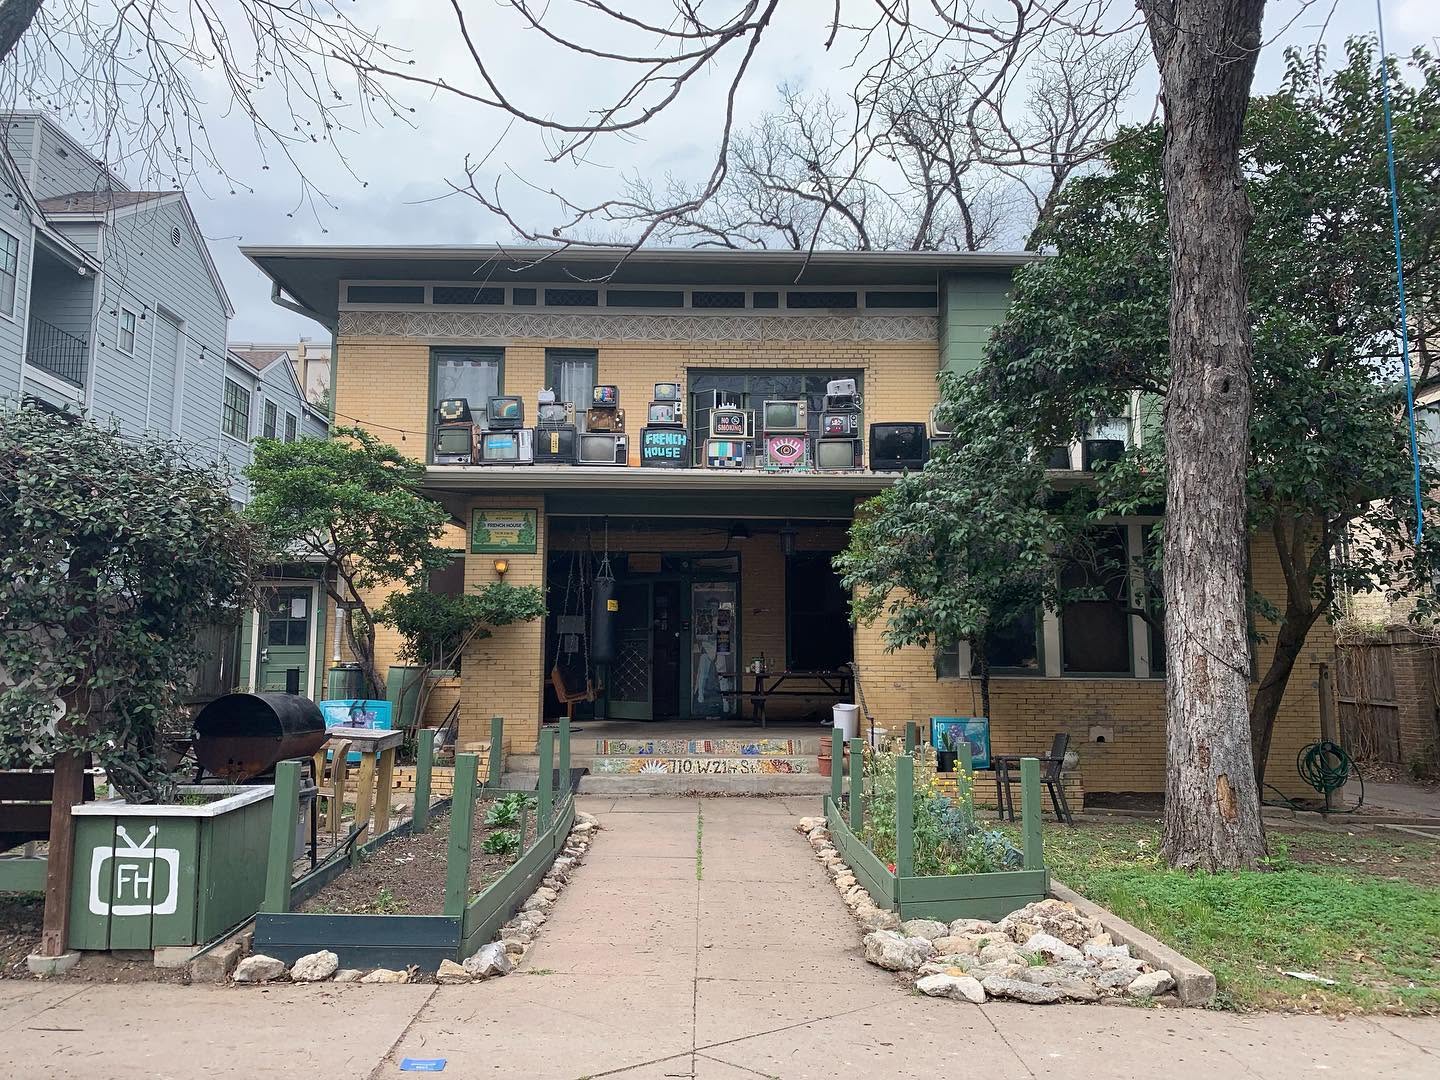
Though I know I could fruitfully connect mapping to my research if given the time, I decided to make a map about a more personal project instead: cooperative student housing in Austin, Texas. As an undergraduate I lived at a number of these “co-ops,” and aside from providing me essential social support and housing, I was always interested in the architecture and history of these homes. Austin is a relatively new city, and its population boom was only in the 2010s, so much of the town is populated by new builds. Co-ops, on the other hand, often originated as depression-era group houses which means many of the buildings date to the 1920s.
Considering Jaskot and Knowles’ proposal that a mapping project ought to be led by spatial questions, the spatial question in this case might be how the presence of the University of Texas affected the distribution of cooperative houses. That said, the other reason I made this map was in the hopes it might be useful to the co-op councils that are in charge of these houses, either for promotion and visibility or logistics. There is always, always, the fear that cooperative housing will cease to exist because of a lack of funds. In a city full of aggressive housing developers, I shudder to think of what might happen to these historic homes if they had to go for sale. This project felt like a small way of giving back to the community that supported me.